
On this page
JFK is at VFR or better in about 82% of hours across the year. The other 18% splits into 9.5% marginal VFR and 8.8% instrument conditions, the hours when the cloud base is under 1,000 feet or visibility is under 3 miles. Those hours are not spread evenly.
May is the worst month for low cloud, with 14.4% of hours at IFR or worse. August is the best, at 3.9%. Winter is not the worst season for it: December to February average 10.4%, well behind May. Winter brings something else, which is wind. Winds or gusts of 25 kt or more show up in 11% to 12% of December to February hours, against about 1% of August hours.
The numbers on this page come from the weather station at the airport itself. We took 227,750 hourly reports from 2000 to 2025, which covers about 99.9% of the hours in that period, and measured how often each condition occurred by month, by hour of day and by runway. Daily rain, snow and temperature records come from NOAA and go back to 1948.
01
JFK weather, month by month
Pick a month to see its numbers and what to expect.
January
Cold, windy and prone to snow.
Daytime highs average 40°F and overnight lows 27°F. On a typical day the range runs from 14°F at the cold end to 53°F at the warm end.
81.8% of hours are VFR. IFR or worse is 9.8%, which makes January the sixth best month of the year for low cloud and poor visibility.
Fog is reported in 1.60% of hours, the second highest of the year. Snow falls in 4.8% of hours, and the month averages 7.8 in of snowfall. Winds or gusts of 25 kt or more occur in 12.4% of hours.
Instrument conditions are most likely 8 am to 9 am, when 11.2% of hours qualify, and least likely 6 pm to 7 pm, at 7.7%.
Mid-January sunrise is around 7:17 am and sunset around 4:51 pm, giving 9.6 hours of daylight. An average January brings 3.1 in of precipitation over 11 days.
The snowiest day on record, 30.3 in, fell on January 23, 2016.
- VFR hours
- 81.8%
- IFR or worse
- 9.8%
- High / low
- 40°F / 27°F
- Daylight
- 9.6 h
- Precipitation
- 3.1 in
- Snowfall
- 7.8 in
- Fog hours
- 1.60%
- 25 kt+ wind
- 12.4%
February
The snowiest month, with the year's worst freezing rain.
82.4% of hours are VFR. IFR or worse is 10.5%, which makes February the fourth worst month of the year for low cloud and poor visibility.
Snow falls in 5.2% of hours, and the month averages 9.1 in of snowfall. Winds or gusts of 25 kt or more occur in 12.2% of hours.
Instrument conditions are most likely 9 am to 10 am, when 11.8% of hours qualify, and least likely 5 pm to 6 pm, at 8.6%.
Daytime highs average 42°F and overnight lows 28°F. On a typical day the range runs from 18°F at the cold end to 54°F at the warm end.
An average February brings 2.9 in of precipitation over 10 days. Mid-February sunrise is around 6:50 am and sunset around 5:28 pm, giving 10.6 hours of daylight.
- VFR hours
- 82.4%
- IFR or worse
- 10.5%
- High / low
- 42°F / 28°F
- Daylight
- 10.6 h
- Precipitation
- 2.9 in
- Snowfall
- 9.1 in
- Fog hours
- 1.30%
- 25 kt+ wind
- 12.2%
March
Still wintry, and the windiest month of the year.
Daytime highs average 50°F and overnight lows 35°F. On a typical day the range runs from 25°F at the cold end to 62°F at the warm end.
Instrument conditions are most likely 3 am to 4 am, when 12.9% of hours qualify, and least likely 8 pm to 9 pm, at 8.0%.
80.3% of hours are VFR. IFR or worse is 10.3%, which makes March the fifth worst month of the year for low cloud and poor visibility.
Snow falls in 3.2% of hours, and the month averages 3.2 in of snowfall. Winds or gusts of 25 kt or more occur in 13.1% of hours.
Mid-March sunrise is around 7:09 am and sunset around 7:01 pm, giving 11.9 hours of daylight.
An average March brings 4.0 in of precipitation over 11 days.
- VFR hours
- 80.3%
- IFR or worse
- 10.3%
- High / low
- 50°F / 35°F
- Daylight
- 11.9 h
- Precipitation
- 4.0 in
- Snowfall
- 3.2 in
- Fog hours
- 1.05%
- 25 kt+ wind
- 13.1%
April
Milder days, but low cloud is already creeping up.
Daytime highs average 60°F and overnight lows 44°F. On a typical day the range runs from 37°F at the cold end to 71°F at the warm end.
79.9% of hours are VFR. IFR or worse is 11.0%, which makes April the second worst month of the year for low cloud and poor visibility.
Instrument conditions are most likely 8 am to 9 am, when 14.7% of hours qualify, and least likely 1 pm to 2 pm, at 8.0%.
Mid-April sunrise is around 6:18 am and sunset around 7:33 pm, giving 13.2 hours of daylight. An average April brings 3.7 in of precipitation over 12 days.
- VFR hours
- 79.9%
- IFR or worse
- 11.0%
- High / low
- 60°F / 44°F
- Daylight
- 13.2 h
- Precipitation
- 3.7 in
- Snowfall
- 0.4 in
- Fog hours
- 1.30%
- 25 kt+ wind
- 10.4%
May
The worst month for low cloud and fog at JFK.
75.0% of hours are VFR. IFR or worse is 14.4%, which makes May the worst month of the year for low cloud and poor visibility.
Fog is reported in 1.44% of hours, the third highest of the year.
Instrument conditions are most likely 6 am to 7 am, when 19.4% of hours qualify, and least likely 3 pm to 4 pm, at 9.6%.
Daytime highs average 69°F and overnight lows 53°F. On a typical day the range runs from 46°F at the cold end to 80°F at the warm end.
An average May brings 3.6 in of precipitation over 12 days. Mid-May sunrise is around 5:39 am and sunset around 8:03 pm, giving 14.4 hours of daylight.
- VFR hours
- 75.0%
- IFR or worse
- 14.4%
- High / low
- 69°F / 53°F
- Daylight
- 14.4 h
- Precipitation
- 3.6 in
- Snowfall
- None to trace
- Fog hours
- 1.44%
- 25 kt+ wind
- 4.7%
June
Warm days start, early mornings are still murky.
Daytime highs average 79°F and overnight lows 63°F. On a typical day the range runs from 56°F at the cold end to 88°F at the warm end.
Instrument conditions are most likely 3 am to 4 am, when 14.5% of hours qualify, and least likely 4 pm to 5 pm, at 5.0%.
80.3% of hours are VFR. IFR or worse is 9.9%, which makes June the sixth worst month of the year for low cloud and poor visibility.
A thunderstorm is reported at the airport in 0.85% of hours. 1.7 days of an average June reach 90°F or hotter. Dew points of 70°F or higher show up in 7% of hours.
Mid-June sunrise is around 5:23 am and sunset around 8:27 pm, giving 15.1 hours of daylight.
An average June brings 4.0 in of precipitation over 11 days.
- VFR hours
- 80.3%
- IFR or worse
- 9.9%
- High / low
- 79°F / 63°F
- Daylight
- 15.1 h
- Precipitation
- 4.0 in
- Snowfall
- None to trace
- Fog hours
- 0.73%
- 25 kt+ wind
- 2.6%
July
Hot, humid and the peak month for thunderstorms.
Daytime highs average 84°F and overnight lows 70°F. On a typical day the range runs from 64°F at the cold end to 91°F at the warm end.
85.0% of hours are VFR. IFR or worse is 5.7%, which makes July the second best month of the year for low cloud and poor visibility.
Fog is rare, reported in only 0.18% of hours. A thunderstorm is reported at the airport in 1.20% of hours. 3.9 days of an average July reach 90°F or hotter. Dew points of 70°F or higher show up in 33% of hours.
Instrument conditions are most likely 2 am to 3 am, when 9.6% of hours qualify, and least likely 1 pm to 2 pm, at 2.1%.
Mid-July sunrise is around 5:36 am and sunset around 8:26 pm, giving 14.8 hours of daylight. An average July brings 3.8 in of precipitation over 10 days.
- VFR hours
- 85.0%
- IFR or worse
- 5.7%
- High / low
- 84°F / 70°F
- Daylight
- 14.8 h
- Precipitation
- 3.8 in
- Snowfall
- None to trace
- Fog hours
- 0.18%
- 25 kt+ wind
- 1.6%
August
The clearest month of the year.
85.7% of hours are VFR. IFR or worse is 3.9%, which makes August the best month of the year for low cloud and poor visibility.
Fog is rare, reported in only 0.11% of hours. A thunderstorm is reported at the airport in 0.93% of hours. 2.5 days of an average August reach 90°F or hotter. Dew points of 70°F or higher show up in 30% of hours.
Instrument conditions are most likely 6 am to 7 am, when 7.6% of hours qualify, and least likely 3 pm to 4 pm, at 1.7%.
Daytime highs average 83°F and overnight lows 69°F. On a typical day the range runs from 63°F at the cold end to 90°F at the warm end.
An average August brings 4.1 in of precipitation over 9 days. Mid-August sunrise is around 6:05 am and sunset around 7:55 pm, giving 13.8 hours of daylight.
- VFR hours
- 85.7%
- IFR or worse
- 3.9%
- High / low
- 83°F / 69°F
- Daylight
- 13.8 h
- Precipitation
- 4.1 in
- Snowfall
- None to trace
- Fog hours
- 0.11%
- 25 kt+ wind
- 1.3%
September
Settled for the most part, with the heaviest rain on record.
Daytime highs average 77°F and overnight lows 62°F. On a typical day the range runs from 54°F at the cold end to 84°F at the warm end.
Instrument conditions are most likely 4 am to 5 am, when 10.1% of hours qualify, and least likely 4 pm to 5 pm, at 4.1%.
84.0% of hours are VFR. IFR or worse is 6.5%, which makes September the fourth best month of the year for low cloud and poor visibility.
Fog is rare, reported in only 0.21% of hours. Dew points of 70°F or higher show up in 11% of hours.
Mid-September sunrise is around 6:35 am and sunset around 7:06 pm, giving 12.5 hours of daylight.
An average September brings 3.8 in of precipitation over 8 days. The wettest day in the station's record, 8.05 in, fell on September 29, 2023.
- VFR hours
- 84.0%
- IFR or worse
- 6.5%
- High / low
- 77°F / 62°F
- Daylight
- 12.5 h
- Precipitation
- 3.8 in
- Snowfall
- None to trace
- Fog hours
- 0.21%
- 25 kt+ wind
- 2.5%
October
Cool and gusty late on, with the most marginal-VFR hours.
Daytime highs average 66°F and overnight lows 51°F. On a typical day the range runs from 42°F at the cold end to 75°F at the warm end.
80.7% of hours are VFR. IFR or worse is 7.3%, which makes October the fifth best month of the year for low cloud and poor visibility.
Instrument conditions are most likely 3 am to 4 am, when 8.7% of hours qualify, and least likely 2 pm to 3 pm, at 5.5%.
Mid-October sunrise is around 7:05 am and sunset around 6:17 pm, giving 11.2 hours of daylight. An average October brings 4.0 in of precipitation over 9 days.
Marginal VFR (ceilings of 1,000 to 3,000 feet, or visibility of 3 to 5 miles) peaks in October at 12.0% of hours.
- VFR hours
- 80.7%
- IFR or worse
- 7.3%
- High / low
- 66°F / 51°F
- Daylight
- 11.2 h
- Precipitation
- 4.0 in
- Snowfall
- 0.1 in
- Fog hours
- 0.55%
- 25 kt+ wind
- 6.5%
November
A quiet month with some of the clearest skies.
85.4% of hours are VFR. IFR or worse is 5.8%, which makes November the third best month of the year for low cloud and poor visibility.
Instrument conditions are most likely 2 am to 3 am, when 6.7% of hours qualify, and least likely 4 pm to 5 pm, at 4.7%.
Daytime highs average 55°F and overnight lows 41°F. On a typical day the range runs from 31°F at the cold end to 65°F at the warm end.
An average November brings 2.9 in of precipitation over 9 days. Mid-November sunrise is around 6:41 am and sunset around 4:39 pm, giving 10.0 hours of daylight.
- VFR hours
- 85.4%
- IFR or worse
- 5.8%
- High / low
- 55°F / 41°F
- Daylight
- 10.0 h
- Precipitation
- 2.9 in
- Snowfall
- 0.4 in
- Fog hours
- 0.66%
- 25 kt+ wind
- 9.2%
December
Fog is back at its annual high, and snow starts.
Daytime highs average 45°F and overnight lows 33°F. On a typical day the range runs from 22°F at the cold end to 56°F at the warm end.
Instrument conditions are most likely 7 am to 8 am, when 13.4% of hours qualify, and least likely 4 pm to 5 pm, at 8.7%.
79.4% of hours are VFR. IFR or worse is 10.9%, which makes December the third worst month of the year for low cloud and poor visibility.
Fog is reported in 1.65% of hours, the first highest of the year. Snow falls in 3.1% of hours, and the month averages 4.9 in of snowfall.
Mid-December sunrise is around 7:11 am and sunset around 4:29 pm, giving 9.3 hours of daylight.
An average December brings 4.2 in of precipitation over 11 days.
- VFR hours
- 79.4%
- IFR or worse
- 10.9%
- High / low
- 45°F / 33°F
- Daylight
- 9.3 h
- Precipitation
- 4.2 in
- Snowfall
- 4.9 in
- Fog hours
- 1.65%
- 25 kt+ wind
- 11.4%
Averages for 2000 to 2025. Tap a month to switch. The hazard calendar puts all twelve side by side.
02
How often JFK is below VFR
Pilots sort every weather report into four flight categories using the lowest cloud ceiling and the visibility. The chart shows how many hours each month fall short of VFR, split by how far short.
May stands out. 6.9% of May hours are in the lowest category, LIFR, where the ceiling is under 500 feet or visibility under a mile. No other month tops 5.1%. Every month from December to April sits between 9.8% and 11.0%.
The summer drop is sharp. August has 3.9% of hours at IFR or worse, about a quarter of May's rate. The other months with low rates are July (5.7%) and November (5.8%).
Share of hours below VFR, by month
Percent of all hourly reports in each month that fell short of VFR.
- LIFR
- IFR
- MVFR
View the numbers
| Month | VFR | MVFR | IFR | LIFR | IFR or worse |
|---|---|---|---|---|---|
| January | 81.8% | 8.4% | 5.7% | 4.1% | 9.8% |
| February | 82.4% | 7.1% | 6.2% | 4.3% | 10.5% |
| March | 80.3% | 9.4% | 6.1% | 4.2% | 10.3% |
| April | 79.9% | 9.1% | 5.9% | 5.1% | 11.0% |
| May | 75.0% | 10.6% | 7.5% | 6.9% | 14.4% |
| June | 80.3% | 9.8% | 5.8% | 4.1% | 9.9% |
| July | 85.0% | 9.4% | 4.0% | 1.7% | 5.7% |
| August | 85.7% | 10.4% | 3.1% | 0.8% | 3.9% |
| September | 84.0% | 9.5% | 4.8% | 1.7% | 6.5% |
| October | 80.7% | 12.0% | 5.1% | 2.2% | 7.3% |
| November | 85.4% | 8.8% | 3.7% | 2.1% | 5.8% |
| December | 79.4% | 9.6% | 6.4% | 4.5% | 10.9% |
The rest of each month is VFR. Hover or tap a bar for the full split.
- VFR
- Ceiling above 3,000 feet and visibility above 5 miles.
- MVFR
- Marginal VFR. Ceiling of 1,000 to 3,000 feet, or visibility of 3 to 5 miles.
- IFR
- Ceiling of 500 to under 1,000 feet, or visibility of 1 to under 3 miles.
- LIFR
- Ceiling under 500 feet, or visibility under 1 mile.
A ceiling counts only broken or overcast layers, or vertical visibility into fog or heavy precipitation. A few scattered clouds do not count.
Sky cover by month
Share of hours by the highest cloud cover reported.
- Clear or few
- Scattered
- Broken
- Overcast
View the numbers
| Month | Clear or few | Scattered | Broken | Overcast |
|---|---|---|---|---|
| January | 25% | 15% | 27% | 33% |
| February | 27% | 15% | 26% | 33% |
| March | 26% | 14% | 27% | 33% |
| April | 23% | 15% | 30% | 32% |
| May | 19% | 17% | 32% | 32% |
| June | 18% | 22% | 37% | 23% |
| July | 19% | 26% | 38% | 17% |
| August | 21% | 26% | 36% | 17% |
| September | 27% | 21% | 31% | 21% |
| October | 29% | 17% | 28% | 26% |
| November | 29% | 16% | 29% | 27% |
| December | 24% | 15% | 29% | 33% |
03
What time of day changes
Each square is one month and one hour of the day (local time) and shows the share of hours that hit the condition you pick. The stronger the colour, the more likely.
The month and the clock interact. In June, instrument conditions run around 14% of hours between 3 and 8 am and drop to around 6% through the afternoon. In January the pattern barely moves: it stays between 8% and 11% all day, because winter low cloud comes with weather systems that do not care what time it is.
Averaged across the year, 7 am to 8 am has the highest chance of instrument conditions (11.3%) and 4 pm to 5 pm has the lowest (6.7%). If you can pick a departure or arrival time and weather is your only worry, the early afternoon is the safer pick in most months.
Condition by month and hour of day
Local time. Pick a condition to repaint the grid.
Ceiling under 1,000 feet or visibility under 3 miles. Peak square: May, 6 am, 19.4% of hours.
Each square is one month and one hour, averaged over all years.
04
Fog and mist
Fog is reported in 0.90% of hours at JFK, about 79 hours in an average year. That adds up to 3.3 full days of fog spread across twelve months, mostly at night and around dawn.
The seasonal pattern has two humps. December and January lead the year at 1.65% and 1.60% of hours, then May climbs back to 1.44%. August is the opposite, at 0.11%.
Fog is a dawn problem. It is most likely 7 am to 8 am (1.71% of those hours) and least likely 3 pm to 4 pm (0.40%). The longest unbroken fog event in the record ran 23 consecutive hourly reports starting January 12, 2018. The longest stretch of instrument conditions of any kind ran 59 hours, starting January 11, 2013.
Mist, the thinner version of fog with visibility between 5/8 mile and 6 miles, appears in 8.4% of hours across the year, and haze in 0.9%.

Share of hours with fog, by month
Fog reported by the station.
View the numbers
| Month | Value (%) |
|---|---|
| January | 1.60 |
| February | 1.30 |
| March | 1.05 |
| April | 1.30 |
| May | 1.44 |
| June | 0.73 |
| July | 0.18 |
| August | 0.11 |
| September | 0.21 |
| October | 0.55 |
| November | 0.66 |
| December | 1.65 |
Fog by hour of day
All months combined, local time.
View the numbers
| Hour | Fog |
|---|---|
| 12 am | 1.09% |
| 1 am | 1.16% |
| 2 am | 1.35% |
| 3 am | 1.34% |
| 4 am | 1.32% |
| 5 am | 1.55% |
| 6 am | 1.67% |
| 7 am | 1.71% |
| 8 am | 1.14% |
| 9 am | 0.90% |
| 10 am | 0.56% |
| 11 am | 0.43% |
| 12 pm | 0.42% |
| 1 pm | 0.41% |
| 2 pm | 0.51% |
| 3 pm | 0.40% |
| 4 pm | 0.51% |
| 5 pm | 0.59% |
| 6 pm | 0.61% |
| 7 pm | 0.69% |
| 8 pm | 0.61% |
| 9 pm | 0.68% |
| 10 pm | 0.82% |
| 11 pm | 1.10% |
05
Thunderstorms, rain and snow
Thunderstorms are a summer event. 68% of the hours with a thunderstorm at the airport fall in June, July and August, and July has the most, at 1.20% of hours.
In an average year JFK logs 32 hours with a thunderstorm at the airport. That counts storms reported over the field. A cell nearby can still slow traffic without being counted here.
Precipitation, with snow counted as its melted water, adds up to 44.1 in a year over about 123 days. It is spread evenly: no month averages less than 2.9 in or more than 4.2 in. The heaviest single day in the record, 8.05 in on September 29, 2023, was 2.2 times an average month's rain, in a single day.
Snow is a December to March affair, with a little in April and November. February is the snowiest month, with snow falling in 5.2% of hours and 9.1 in a month on average. Freezing rain and ice pellets, the nastier winter precipitation, show up most in February too, in 1.08% of hours. Average snowfall is 25.8 in a year, but the spread is wide: from 2.1 in in 2023 to 62.0 in in 2003.
Share of hours with a thunderstorm at the airport
By month.
View the numbers
| Month | Value (%) |
|---|---|
| January | 0.03 |
| February | 0.01 |
| March | 0.06 |
| April | 0.27 |
| May | 0.49 |
| June | 0.85 |
| July | 1.20 |
| August | 0.93 |
| September | 0.34 |
| October | 0.14 |
| November | 0.03 |
| December | 0.02 |
Average precipitation by month
Inches of rain and melted snow.
View the numbers
| Month | Value ( in) |
|---|---|
| January | 3.1 |
| February | 2.9 |
| March | 4.0 |
| April | 3.7 |
| May | 3.6 |
| June | 4.0 |
| July | 3.8 |
| August | 4.1 |
| September | 3.8 |
| October | 4.0 |
| November | 2.9 |
| December | 4.2 |
Average snowfall by month
Inches of snowfall depth, average over the years.
View the numbers
| Month | Value ( in) |
|---|---|
| January | 7.8 |
| February | 9.1 |
| March | 3.2 |
| April | 0.4 |
| May | 0.0 |
| June | 0.0 |
| July | 0.0 |
| August | 0.0 |
| September | 0.0 |
| October | 0.1 |
| November | 0.4 |
| December | 4.9 |
06
Wind, gusts and runway crosswinds
JFK has two runway axes: 4/22 (about 31 degrees true) and 13/31 (about 121 degrees true). Each hour's wind has a crosswind component on each axis, and the airport always has at least one runway that lines up better.
Wind at JFK blows most often from the south (14%), the west (9%) and the north (9%), as a share of hours with a wind of 3 knots or more. The wind rose shows it for the whole year or for any single month.
Measured against the better-aligned of the two axes, the crosswind stays at or under 13 kt in 96.6% of hours, and at or under 10.5 kt in 94.0%. At 16 kt the figure is 98.7%, and at 20 kt it is 99.7%. The 95% mark is the usual benchmark for how well a runway layout suits the local wind, and JFK clears it at the 13 kt level.
Where the wind comes from
Share of hours by direction the wind blows from and speed. Lines mark the runway axes.
- 3 to 9 kt
- 10 to 17
- 18 to 24
- 25 or more
- Runway axes
Speed uses the stronger of sustained wind and gust. Calm hours (under 3 kt) are left out of the rose.
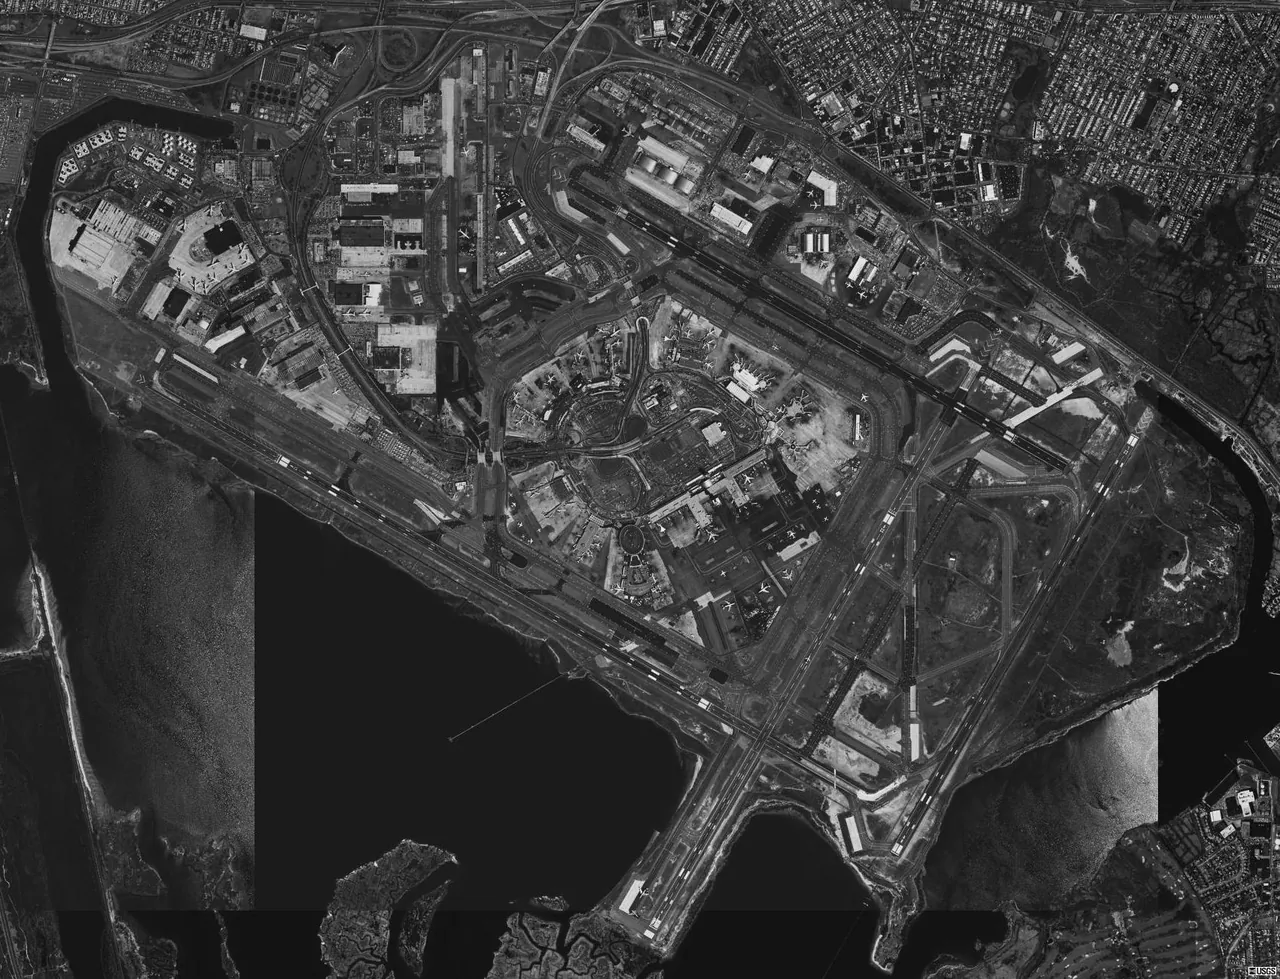

The two axes are not equal. A crosswind above 15 kt blows across the 4/22 axis in 12.6% of hours, against 6.5% for 13/31. West and northwest winds line up with the 13/31 axis, while south and southwest winds line up with 4/22. The all-runway version, hours when even the best runway has more than 15 kt of crosswind, peaks in March at 3.38% and bottoms out in August at 0.45%.
JFK runways and crosswind exposure
Drawn to scale, north up. A stronger colour means crosswind above 15 kt in more hours.
View the numbers
| Runway axis | Over 15 kt | Over 20 kt |
|---|---|---|
| 04/22 | 12.6% of hours | 7.8% of hours |
| 13/31 | 6.5% of hours | 2.7% of hours |
Runway positions from OurAirports. Terminals and taxiways are not shown.
Gusts follow the seasons the same way. Winds or gusts of 25 kt or more occur in 13.1% of March hours and 1.3% of August hours. The strongest wind in the record, 69 kt, was reported on October 29, 2012, during Superstorm Sandy.
Share of hours with wind or gusts of 25 kt or more
By month.
View the numbers
| Month | Value (%) |
|---|---|
| January | 12.4 |
| February | 12.2 |
| March | 13.1 |
| April | 10.4 |
| May | 4.7 |
| June | 2.6 |
| July | 1.6 |
| August | 1.3 |
| September | 2.5 |
| October | 6.5 |
| November | 9.2 |
| December | 11.4 |
Hours when even the best runway has over 15 kt of crosswind
Share of hours, by month.
View the numbers
| Month | Value (%) |
|---|---|
| January | 2.91 |
| February | 2.66 |
| March | 3.38 |
| April | 3.24 |
| May | 1.23 |
| June | 0.70 |
| July | 0.54 |
| August | 0.45 |
| September | 0.94 |
| October | 2.16 |
| November | 2.10 |
| December | 3.07 |
Which runway end the wind favours
If you pick the runway end with the biggest headwind for every hour, wind alone points to runway 22 32% of the time, 31 28%, 4 21% and 13 14%, with 5% calm. In January the wind favours 31 in 47% of hours. In July it favours 22 in 50%. Actual runway use also depends on traffic, noise rules and the other New York airports, so treat this as the wind's vote and not the airport's decision.
- Runway 31
- 22
- 4
- 13
- Calm
View the numbers
| Month | 31 | 22 | 4 | 13 | Calm |
|---|---|---|---|---|---|
| January | 47% | 25% | 19% | 6% | 4% |
| February | 41% | 26% | 21% | 9% | 4% |
| March | 36% | 24% | 22% | 15% | 4% |
| April | 27% | 28% | 21% | 20% | 4% |
| May | 17% | 34% | 20% | 23% | 6% |
| June | 18% | 43% | 15% | 18% | 5% |
| July | 14% | 50% | 15% | 16% | 5% |
| August | 15% | 44% | 20% | 16% | 6% |
| September | 15% | 31% | 31% | 17% | 6% |
| October | 27% | 29% | 27% | 11% | 6% |
| November | 36% | 28% | 22% | 9% | 5% |
| December | 44% | 24% | 21% | 7% | 4% |
A wind-only estimate. It is not a record of the runways ATC actually used.
07
Temperature, humidity and daylight
Average highs run from 40°F in January to 84°F in July. The shaded bands cover the middle 80% of days, so the cold and hot ends of a normal month are inside them.
Over an average year, 8.8 days reach 90°F or hotter and 13.8 days never climb above freezing. The low drops to 32°F or below on 73.7 nights. The station's all-time extremes since 1948 are 104°F on July 3, 1966 and -2°F on February 8, 1963.
Humidity matters most in July and August. Dew points of 70°F or higher, the point where the air feels oppressive, show up in 33% of July hours and 30% of August hours. They are essentially absent from November to April.
Average high and low by month
Lines are the average. Shaded bands cover the middle 80% of days.
- Daily high
- Daily low
View the numbers
| Month | Average high | Average low | Days 90F+ | Nights 32F or colder | Record high | Record low |
|---|---|---|---|---|---|---|
| January | 40°F | 27°F | 0.0 | 21.3 | 71°F (2007) | -2°F (1985) |
| February | 42°F | 28°F | 0.0 | 20.1 | 71°F (1997) | -2°F (1963) |
| March | 50°F | 35°F | 0.0 | 11.3 | 85°F (1990) | 7°F (1967) |
| April | 60°F | 44°F | 0.0 | 1.2 | 90°F (1977) | 20°F (1982) |
| May | 69°F | 53°F | 0.2 | 0.0 | 99°F (1969) | 34°F (1966) |
| June | 79°F | 63°F | 1.7 | 0.0 | 102°F (2025) | 45°F (1967) |
| July | 84°F | 70°F | 3.9 | 0.0 | 104°F (1966) | 55°F (1963) |
| August | 83°F | 69°F | 2.5 | 0.0 | 101°F (1948) | 46°F (1965) |
| September | 77°F | 62°F | 0.5 | 0.0 | 98°F (1983) | 40°F (1950) |
| October | 66°F | 51°F | 0.0 | 0.1 | 95°F (2019) | 30°F (1962) |
| November | 55°F | 41°F | 0.0 | 3.8 | 82°F (2024) | 15°F (2018) |
| December | 45°F | 33°F | 0.0 | 15.9 | 75°F (1998) | 2°F (1983) |
Dashed line marks freezing.
Share of hours with a dew point of 70F or higher
By month.
View the numbers
| Month | Value (%) |
|---|---|
| January | 0.0 |
| February | 0.0 |
| March | 0.0 |
| April | 0.0 |
| May | 0.2 |
| June | 7.1 |
| July | 32.7 |
| August | 29.6 |
| September | 10.7 |
| October | 0.9 |
| November | 0.0 |
| December | 0.0 |
Daylight swings from 9.3 hours in mid-December to 15.1 hours in mid-June. The chart shows sunrise and sunset through the year in local clock time, so the two small steps are the clocks changing.
Sunrise and sunset
Local clock time. The shaded band is daylight; the small steps are the clocks changing.
View the numbers
| Month | Sunrise | Sunset | Daylight |
|---|---|---|---|
| January | 7:17 am | 4:51 pm | 9.6 hours |
| February | 6:50 am | 5:28 pm | 10.6 hours |
| March | 7:09 am | 7:01 pm | 11.9 hours |
| April | 6:18 am | 7:33 pm | 13.2 hours |
| May | 5:39 am | 8:03 pm | 14.4 hours |
| June | 5:23 am | 8:27 pm | 15.1 hours |
| July | 5:36 am | 8:26 pm | 14.8 hours |
| August | 6:05 am | 7:55 pm | 13.8 hours |
| September | 6:35 am | 7:06 pm | 12.5 hours |
| October | 7:05 am | 6:17 pm | 11.2 hours |
| November | 6:41 am | 4:39 pm | 10.0 hours |
| December | 7:11 am | 4:29 pm | 9.3 hours |
08
Check a date
Pick any day of the year. The odds are built from the 26 years of reports, using a window of seven days either side of your date to smooth out one-off weather.
October 13 at JFK
Chance of low cloud or poor visibility (IFR or worse)
- Overnight12 am to 6 am7.0%
- Morning6 am to noon8.3%
- Afternoonnoon to 6 pm4.6%
- Evening6 pm to midnight5.8%
The day
- Typical high
- 67°F
- Typical low
- 52°F
- Sunrise
- 7:04 am
- Sunset
- 6:18 pm
- Measurable precipitation
- 30% of days
- Snow of 0.1 in or more
- 0% of days
- Wind or gusts 25 kt+
- 6.1% of hours
Odds describe how often something happened on and around this date in 2000 to 2025. They are not a forecast.
09
Year to year
A year can be well away from the average. The share of hours at IFR or worse has ranged from 5.8% in 2016 to 12.6% in 2003, around an average of 8.8%.
There is no clear trend across the 26 years: low-cloud years and clear years are scattered through the series. Rainfall swings too, from 32.7 in in 2001 to 57.4 in in 2018.
Share of hours at IFR or worse, by year
Each bar is one calendar year.
View the numbers
| Year | IFR or worse |
|---|---|
| 2000 | 9.0% |
| 2001 | 8.1% |
| 2002 | 7.6% |
| 2003 | 12.6% |
| 2004 | 9.8% |
| 2005 | 10.2% |
| 2006 | 7.3% |
| 2007 | 8.6% |
| 2008 | 8.2% |
| 2009 | 8.9% |
| 2010 | 6.7% |
| 2011 | 11.2% |
| 2012 | 8.7% |
| 2013 | 8.2% |
| 2014 | 8.2% |
| 2015 | 8.9% |
| 2016 | 5.8% |
| 2017 | 10.4% |
| 2018 | 10.6% |
| 2019 | 9.7% |
| 2020 | 9.1% |
| 2021 | 7.6% |
| 2022 | 8.1% |
| 2023 | 9.3% |
| 2024 | 8.1% |
| 2025 | 8.1% |
Total precipitation, by year
Inches of rain and melted snow.
View the numbers
| Year | Inches |
|---|---|
| 2000 | 41 in |
| 2001 | 33 in |
| 2002 | 43 in |
| 2003 | 45 in |
| 2004 | 51 in |
| 2005 | 50 in |
| 2006 | 45 in |
| 2007 | 47 in |
| 2008 | 46 in |
| 2009 | 46 in |
| 2010 | 43 in |
| 2011 | 56 in |
| 2012 | 40 in |
| 2013 | 36 in |
| 2014 | 51 in |
| 2015 | 38 in |
| 2016 | 36 in |
| 2017 | 43 in |
| 2018 | 57 in |
| 2019 | 52 in |
| 2020 | 41 in |
| 2021 | 44 in |
| 2022 | 36 in |
| 2023 | 53 in |
| 2024 | 41 in |
| 2025 | 34 in |
Total snowfall, by year
Inches of snowfall depth.
View the numbers
| Year | Inches |
|---|---|
| 2000 | 26 in |
| 2001 | 22 in |
| 2002 | 16 in |
| 2003 | 62 in |
| 2004 | 23 in |
| 2005 | 39 in |
| 2006 | 20 in |
| 2007 | 11 in |
| 2008 | 14 in |
| 2009 | 34 in |
| 2010 | 47 in |
| 2011 | 28 in |
| 2012 | 7 in |
| 2013 | 20 in |
| 2014 | 39 in |
| 2015 | 44 in |
| 2016 | 45 in |
| 2017 | 34 in |
| 2018 | 34 in |
| 2019 | 12 in |
| 2020 | 9 in |
| 2021 | 28 in |
| 2022 | 22 in |
| 2023 | 2 in |
| 2024 | 16 in |
| 2025 | 18 in |
10
JFK, LaGuardia and Newark compared
The same method, applied to the other two big New York area airports, using the same 26 years.
JFK has more instrument conditions than either neighbour: 8.8% of hours, against 7.9% at LaGuardia and 8.2% at Newark. It is the worst of the three in 7 months of the year. Fog is where the gap is widest: 0.90% of hours at JFK, 0.46% at LaGuardia and 0.31% at Newark.
Crosswind coverage at 13 kt is 96.6% at JFK, 96.7% at LaGuardia and 95.1% at Newark, using each airport's own runway headings.
Share of hours at IFR or worse, by month and airport
Same method and same years for all three airports.
- JFK
- LaGuardia
- Newark
The three airports side by side
| Measure | JFK | LaGuardia | Newark |
|---|---|---|---|
| VFR hours | 81.7% | 81.9% | 81.3% |
| IFR or worse hours | 8.8% | 7.9% | 8.2% |
| Fog hours | 0.90% | 0.46% | 0.31% |
| Fog hours in a year | 79 | 40 | 27 |
| Thunderstorm hours in a year | 32 | 34 | 44 |
| Wind or gusts 25 kt+ | 7.3% | 6.1% | 4.8% |
| Crosswind coverage at 13 kt | 96.6% | 96.7% | 95.1% |
11
Best and worst months by hazard
Each row is a different weather problem. A stronger colour means a higher rate that month, and the three worst months for each hazard have the strongest colour.
Hazard calendar
The strongest-coloured cells are the three worst months for that row. A pale cell with a 0 means none at all.
View the numbers
| Hazard | Jan | Feb | Mar | Apr | May | Jun | Jul | Aug | Sep | Oct | Nov | Dec |
|---|---|---|---|---|---|---|---|---|---|---|---|---|
| Low cloud (IFR or worse) | 10 | 11 | 10 | 11 | 14 | 10 | 6 | 4 | 7 | 7 | 6 | 11 |
| Fog | 1.6 | 1.3 | 1.1 | 1.3 | 1.4 | 0.7 | 0.2 | 0.1 | 0.2 | 0.6 | 0.7 | 1.7 |
| Thunderstorm at the airport | <0.1 | <0.1 | 0.1 | 0.3 | 0.5 | 0.9 | 1.2 | 0.9 | 0.3 | 0.1 | <0.1 | <0.1 |
| Snow | 4.8 | 5.2 | 3.2 | 0.2 | <0.1 | 0.0 | <0.1 | 0.0 | 0.0 | 0.1 | 0.4 | 3.1 |
| Freezing rain or ice pellets | 0.4 | 1.1 | 0.6 | 0.1 | 0.0 | 0.0 | 0.0 | 0.0 | 0.0 | 0.0 | 0.1 | 0.3 |
| Wind or gusts 25 kt+ | 12 | 12 | 13 | 10 | 5 | 3 | 2 | 1 | 3 | 6 | 9 | 11 |
| Crosswind over 15 kt (all runways) | 2.9 | 2.7 | 3.4 | 3.2 | 1.2 | 0.7 | 0.5 | 0.5 | 0.9 | 2.2 | 2.1 | 3.1 |
| Heat (days of 90F or hotter) | 0.0 | 0.0 | 0.0 | 0.0 | 0.2 | 1.7 | 3.9 | 2.5 | 0.5 | 0.0 | 0.0 | 0.0 |
| Frost (nights of 32F or colder) | 21 | 20 | 11 | 1 | 0 | 0 | 0 | 0 | 0 | <1 | 4 | 16 |
| Humid (dew point 70F+) | 0 | 0 | 0 | 0 | <1 | 7 | 33 | 30 | 11 | 1 | 0 | 0 |
Cloud, wind and humidity values are percent of hours, and snow, fog and storms too. Heat and frost are days in an average year. A value shown as <0.1 or <1 is above zero but under that figure.
12
Records and extremes
- Hottest day on record104°FJuly 3, 1966
- Coldest night on record-2°FFebruary 8, 1963
- Heaviest rain in a day8.05 inSeptember 29, 2023
- Most snow in a day30.3 inJanuary 23, 2016
- Strongest wind reported69 ktOctober 29, 2012
- Longest run of IFR or worse59 hoursfrom January 11, 2013
- Longest fog event23 hoursfrom January 12, 2018
Temperature, rain and snow records cover 1948 to 2025. Wind and fog records cover 2000 to 2025.
13
Planning around JFK weather
If you are flying through JFK
- Weather is only one cause of delays at JFK and this page measures the weather, not the delays. Low cloud, thunderstorms, snow and strong wind are the conditions that commonly slow New York area traffic.
- May and December, January and February are the months with the most low-cloud hours. If you have a choice, August, November and July have the fewest.
- Morning departures see more fog and low cloud, mostly in April to June. By early afternoon the odds are lower. Thunderstorms at the airport peak 7 pm to 8 pm, so a late departure in July trades one risk for another.
- Winter delays come from snow, ice and gusts. When a storm is forecast, the airline's weather waiver page is the place to check before you travel.
If you are flying a light aircraft
- JFK is at or above VFR minimums about 82% of hours across the year, but only 75% of the time in May.
- Many light singles have a demonstrated crosswind component of around 15 knots. At 13 kt the better runway handles 96.6% of hours here, and at 16 kt it handles 98.7%.
- From December to March, winds or gusts of 25 kt or more appear in more than 11% of hours, a rate that matches or beats the low-cloud rate in each of those months.
- Climatology tells you what is normal. It does not replace the current METAR and TAF, the official briefing or your own judgement as pilot in command.
This page is for general information and trip planning. It is not an aviation weather briefing and must not be used for flight planning. Always get current weather from an official source such as aviationweather.gov or 1-800-WX-BRIEF before flying.
14
Questions about JFK weather
What is the worst month for weather at JFK?
It depends on the problem. May has the most low cloud, at 14.4% of hours at IFR or worse. February has the most snow, July has the most thunderstorms and March has the strongest winds and crosswinds. August is the clearest month overall.
How much does it snow at JFK?
An average of 25.8 in a year, with 5.7 days of an inch or more. February averages 9.1 in and January averages 7.8 in. Totals swing a lot between winters, from 2.1 in in 2023 to 62.0 in in 2003.
How foggy is JFK?
Fog is reported in 0.90% of hours, around 79 hours in an average year. It peaks in December and January, with a second rise in May, and it is most likely 7 am to 8 am.
When are thunderstorms most likely at JFK?
June to August hold 68% of thunderstorm hours. July leads at 1.20% of hours. Over a full year the airport logs about 32 hours with a thunderstorm at the field.
Which JFK runways get the worst crosswinds?
Crosswind above 15 kt blows across the 4/22 axis in 12.6% of hours and across 13/31 in 6.5%. Taking the better of the two axes, crosswind stays at or under 13 kt in 96.6% of hours.
What time of day has the best weather at JFK?
Across the year, 4 pm to 5 pm has the lowest chance of instrument conditions (6.7%) and 7 am to 8 am has the highest (11.3%). The gap is much bigger in spring and summer than in winter.
Is JFK foggier than LaGuardia or Newark?
Yes. Fog is reported in 0.90% of JFK hours, 0.46% at LaGuardia and 0.31% at Newark. JFK also has the highest share of IFR-or-worse hours of the three.
Is this the weather forecast?
No. It is climatology: how often each condition happened in 2000 to 2025. For the current report and forecast at JFK use the METAR and TAF for KJFK from aviationweather.gov.
Where does the data come from?
Hourly reports come from the automated weather station at JFK (KJFK), archived by the Iowa Environmental Mesonet. Daily temperature, rain and snow come from NOAA's Global Historical Climatology Network for the JFK station. Runway positions come from OurAirports.
15
Where the numbers come from
Sources
- Hourly observations
- Routine hourly reports (METAR) from the automated surface observing station at JFK, KJFK, 2000 to 2025, archived by the Iowa Environmental Mesonet at Iowa State University. The underlying data is produced by the US National Weather Service and is in the public domain. 227,750 hours after removing duplicate reports, about 99.9% complete.
- Daily climate
- NOAA National Centers for Environmental Information, Global Historical Climatology Network Daily, station USW00094789 (JFK International Airport). Temperature, rain, snowfall and snow depth. Averages use 2000 to 2025. Records use the full station history from 1948.
- Runway geometry
- Runway end coordinates and true headings from OurAirports, a public domain airport database. JFK: 4L/22R and 4R/22L at about 31 degrees true, 13L/31R and 13R/31L at about 121 degrees true. LaGuardia and Newark use their own published headings.
- Sun times
- Sunrise and sunset are computed for the airport coordinates with the NOAA solar position equations and shown in local clock time with daylight saving applied.
Definitions
- Flight category
- The FAA categories VFR, MVFR, IFR and LIFR, from the lowest cloud ceiling (broken, overcast or vertical visibility) and the visibility in statute miles. Visibility is capped at 10 miles in routine reports.
- Fog, snow, thunderstorm
- Counted from the present weather codes in each report. Fog excludes "in the vicinity" reports. Thunderstorm means a thunderstorm at the airport, not near it.
- Wind
- Reported direction is true. Where a gust is reported we use the gust, since it is what a crosswind limit has to cover. Calm and variable winds count as no crosswind.
- Crosswind coverage
- The share of hours when the better-aligned runway axis has a crosswind component at or under a given speed.
- Runway-favoured
- For each hour we choose the runway end with the largest headwind component. It is a wind-only estimate and not a record of runway use.
Limits
- Only routine hourly reports are used, so very short fog or visibility drops between reports are missed. Real figures for brief events are a little higher.
- Winds in the report are a two-minute average, so peak gusts between reports are missed too.
- Sensor errors are removed from wind and temperature (anything physically implausible). We checked the record extremes against known events.
- The 26-year window is long enough to show seasons and the hour-of-day pattern, but not long enough to settle small differences between neighbouring months.
Weather data: US National Weather Service and NOAA, via the Iowa Environmental Mesonet. PilotPassion is not affiliated with, endorsed by or sponsored by NOAA, the National Weather Service or the FAA.